
Isle of Wight South Strategic Optimisation (2023)
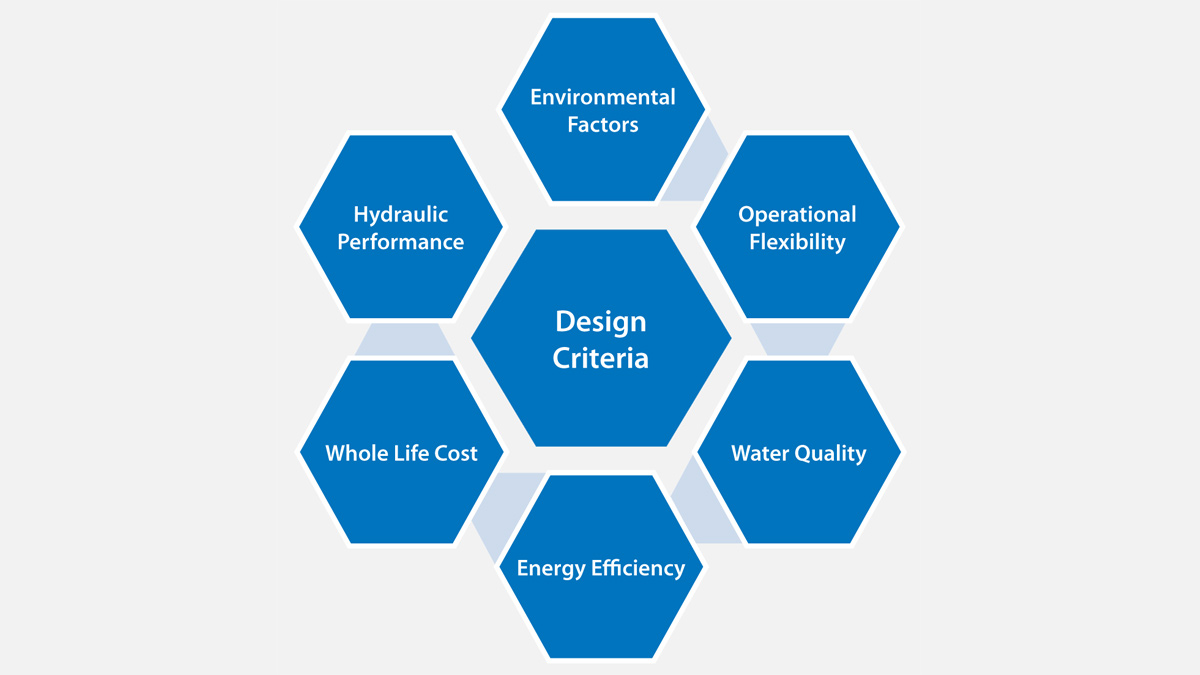
Figure 1: Design criteria developed for optimisation - Courtesy of Southern Water
Forming part of Southern Water’s (SW) Hampshire supply region, the Isle of Wight (IoW) is located just off the south coast of England and is divided into two water distribution zones (WDZ), namely IoW North and IoW South. The IoW South comprises major towns of Ryde, Sandown, Shanklin and Ventnor with multiple villages and more remote rural areas forming the wider distribution network. The water sources and distribution systems have been brought together, with their origins being from former smaller localised systems developed in the late 19th century, which were added to in the 20th century as the IoW population grew, to form an integrated system. Today, there are five existing small and medium sized water supply works (WSW) with a combined daily output of 18 ML supplying customers via several small water service reservoirs (WSR). The water distribution network totals approximately 547 km of mains, serving a population of approximately 45,000 people.
Project driver
The Cooks Castle WSR has been identified for replacement based on asset condition and the associated security of supply risks to customers. This project aims to provide a long term solution for storage requirements and enhance the network associated with the removal/replacement of this existing WSR. To validate the need and determine the optimum size, top water level and location of any new WSR, a solution needed to be developed considering a wider, integrated view of water sources, network storage and water distribution now and into the future. The business planning objectives were broadly defined as:
- Create a more resilient water supply network for future generations (Southern Water Network 2030 rationalisation).
- Maintain levels of service to customers and mitigate water quality risks.
- Ensure future growth and proposed new sources can be integrated (Water Resource Management Plan – WRMP) and reduce dependency on the bulk transfer from the mainland via the Cross Solent Mains.
- Increase operational flexibility through optimisation of existing/new assets.
- Improve security of supply to customers (zonal storage provided in line with Southern Water Asset Class Policy).
- Decommission surplus assets to reduce cost of maintenance.
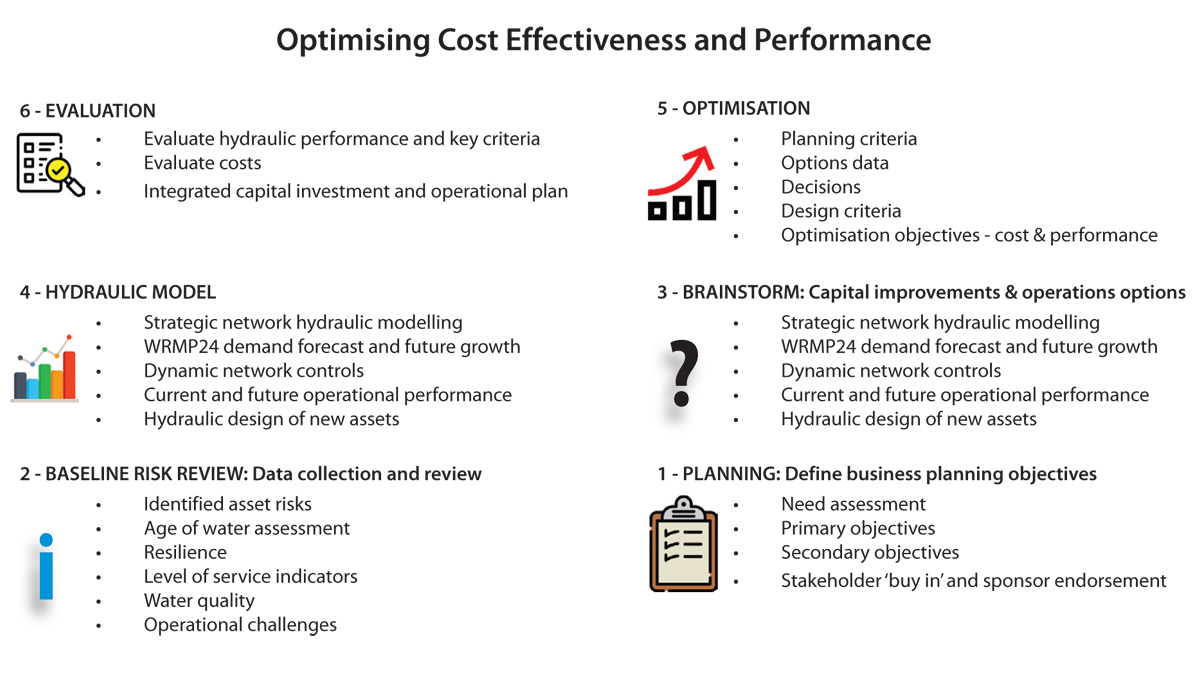
Figure 2: The planning process developed – Courtesy of Southern Water
Optimisation
The Optimatics’ OptimizerTM tool was used, allowing the team to analyse up to 35,0000 plans (the group of assets the Optimizer chose to test) in a single optimisation run (see Figure 1 – top of page). OptimizerTM was allowed to generate plans incorporating both new asset options and removing or retaining existing assets. New options tested included a total of approximately 80km of strategic mains in varying diameters, over 20 WSR configurations in five different locations, decommissioning of existing WSRs and associated rezoning, rationalisation of WSWs and provision of new pumping stations.
The OptimizerTM evaluated plans using input ‘design criteria’ which were formulated and aligned with the project planning objectives and Southern Water standards. More complex ‘rule-based adjusters’ were formulated to allow automation of controls and prevent Optimizer from selecting options which conflicted with one another, e.g. to prevent Optimizer’s ability to select multiple sizes of WSR at the same location. The evaluation of these design criteria by the OptimizerTM produced a cost and performance evaluation for each plan. The best performing plans were then compared with each other on a Pareto curve – see Figure 3.
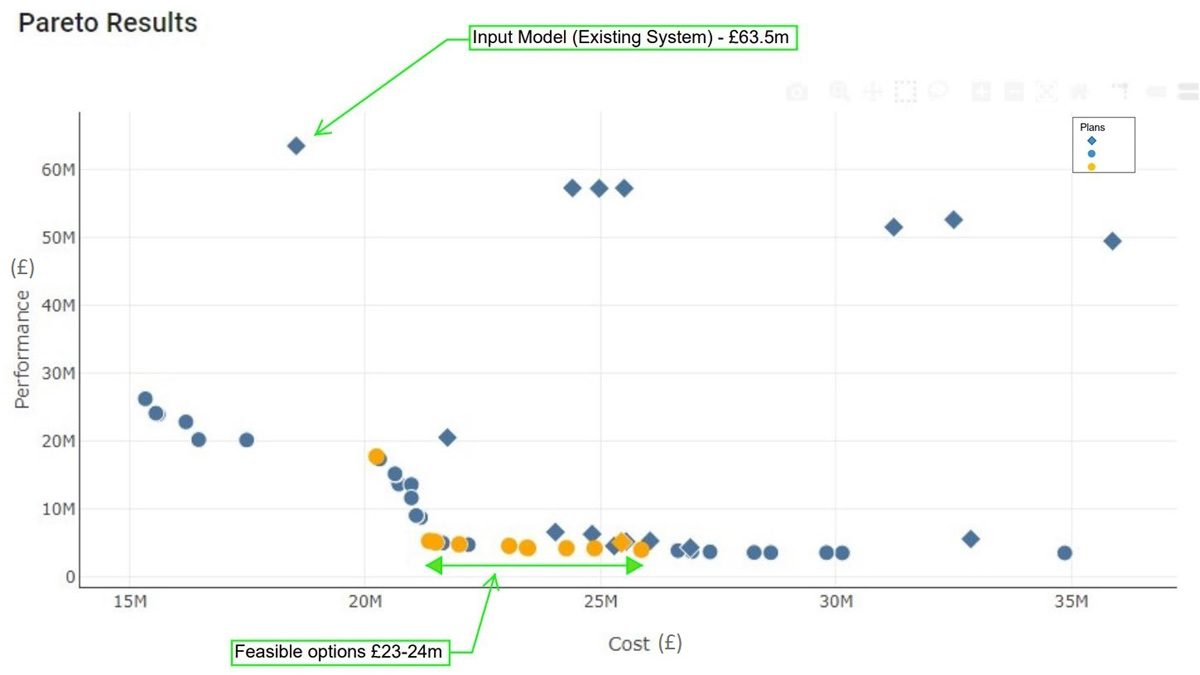
Figure 3: Typical Pareto curve showing best performing plans – Courtesy of Southern Water
Incorporating environmental performance into the optimisation was a particular challenge. The team approached this by taking the results from a high level environmental feasibility assessment and factoring in WSR and pipe costs proportionally to reflect better and worse performing options. This then carried through into the overall cost/performance results for that plan.
In the example, the Pareto curve shows about 216 OptimizerTM plans (from 30,000) from which 10 plans have been identified as feasible options.
The OptimizerTM tool is very powerful at testing several configurations (plans) based on the given inputs, design criteria and formulations. Review and validation are critical parts of the process, and this involves the team checking outputs (individual plan performance), tweaking inputs (adjusting costs/penalties/formulations) and refining the optimisation until several tangible plans are derived.
Figure 4 shows typical age of water results for several WSRs with shortlisted plan 7639, 8142 & 8041 compared against the existing system performance. This demonstrates how the optimised plans can significantly reduce the age of water meeting one of the projects key objectives.
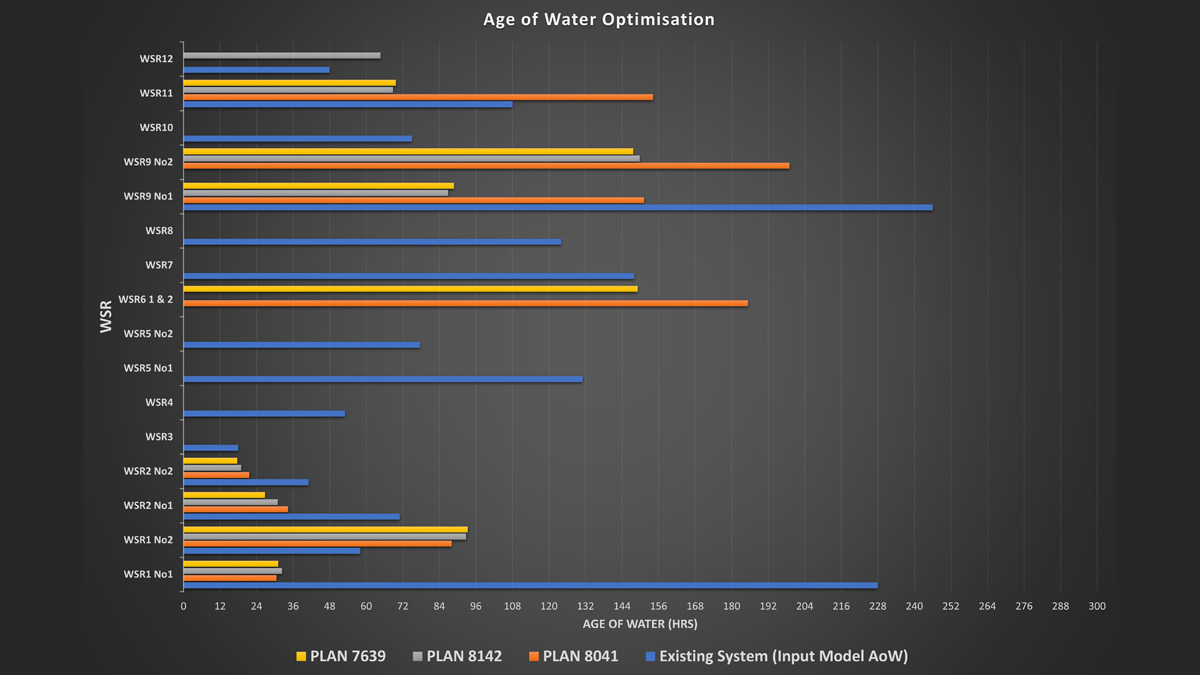
Figure 4: Age of water optimisation – Courtesy of Southern Water
Defining outputs: the optimal integrated solution
Taking a short list of tangible plans from the optimisation is a starting point which allowed the team to define the pathway to the final integrated solution. Not all factors can be simply incorporated into OptimizerTM therefore these external factors need consideration alongside the optimisation outputs to form the final integrated solution.
One important factor was implementation of solutions over several AMP cycles and ensuring that staged development did not detrimentally impact on customer levels of service. Similarly, consideration of outage scenarios, e.g. WSW shutdowns and mains bursts were considered outside of the optimisation, then retrospectively tested against the shortlisted network configurations.
The solution
The final integrated solution comprised:
- Network connections to a single rationalised WSW using three input water sources (currently two separate WSW with two sources). This aligns with WRMP and improves IoW drought resilience.
- Removal of seven existing WSRs reducing asset risk through deterioration, maintenance costs and age of water issues.
- Provision of one new strategic WSR providing wider security of supply to several district metered areas (DMAs) compared to current configuration.
- Trunk mains reinforcements and new installation/upgrading of network pumping stations to support strategic transfers from proposed WSWs to WSRs and customers.
- Increased operational efficiency and lower OPEX by considering rezoning, triad periods and exploiting opportunities to modify the current network via simple valving operations.