

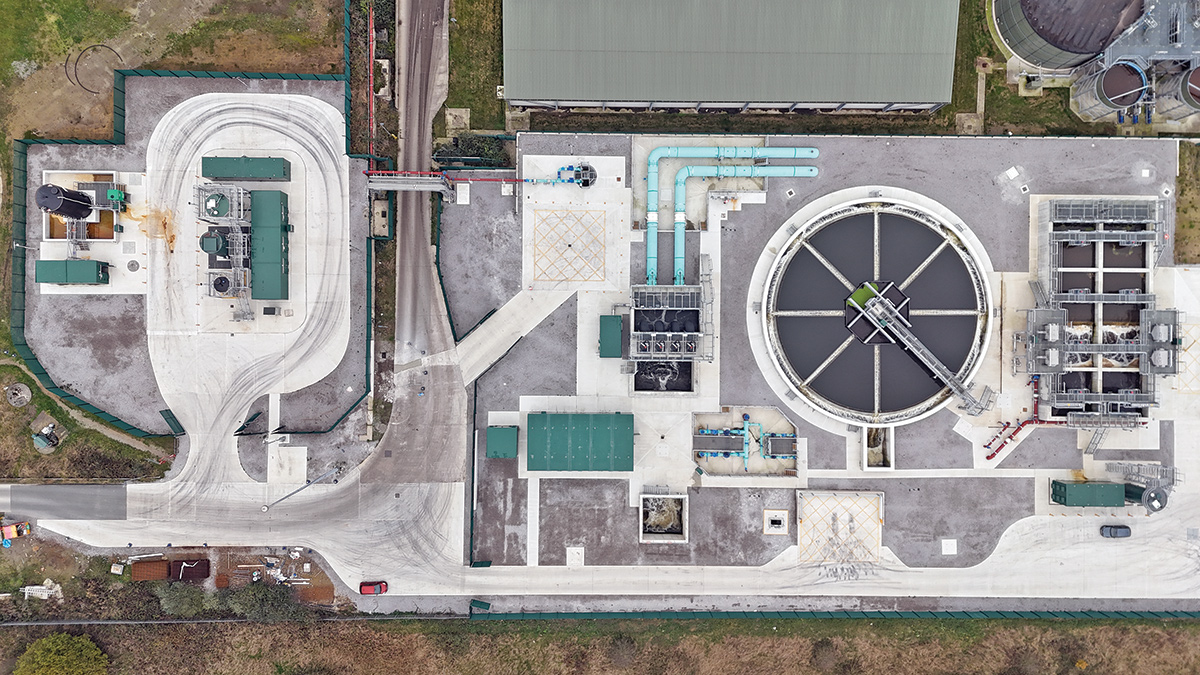
Knostrop STW (2025)
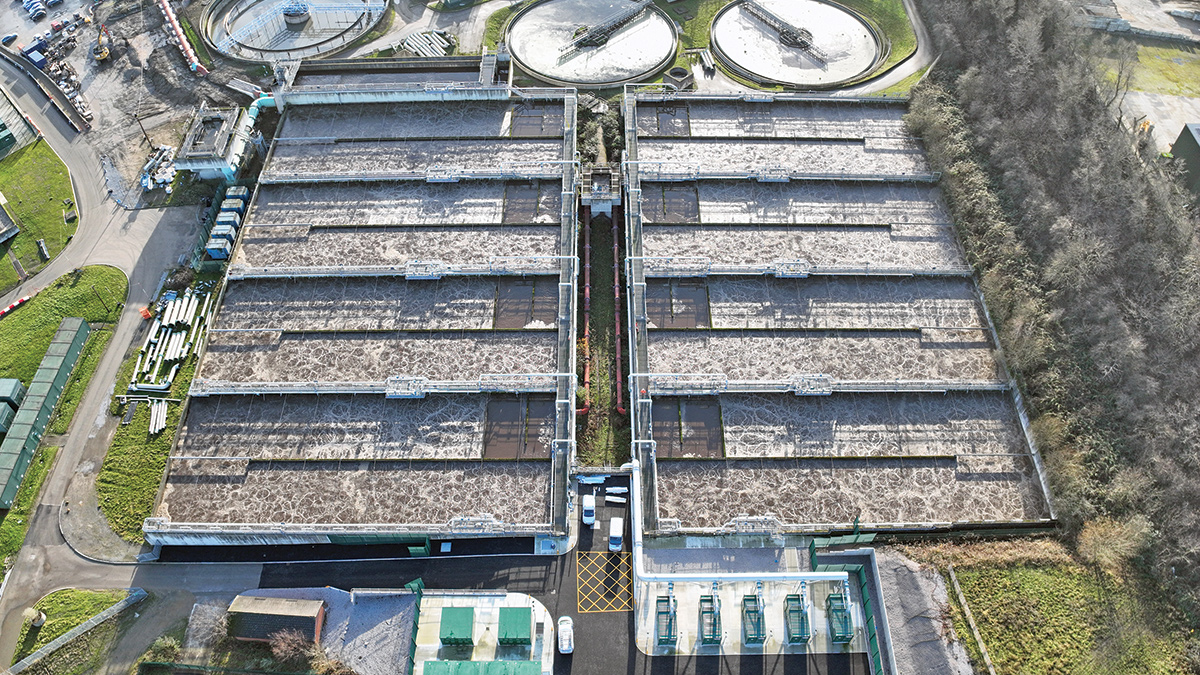
Knostrop STW - Courtesy of SkyTech Surveys
Under the AMP7 Water Industry National Environment Programme (WINEP), Yorkshire Water was required to achieve compliance with the new Total Phosphorus and Total Iron permit levels at 80 wastewater treatment works, including Knostrop Sewage Treatment Works. As Knostrop STW is Yorkshire Water’s largest wastewater treatment site, (serving a population equivalent of 990,000), the project introduced both an Enhanced Biological Phosphorus Removal (EBPR) process into the secondary treatment phase, and a CoMag® tertiary solids removal (TSR) plant to treat the final effluent. These two processes were then able to comply to the new Water Framework Directive of 0.4 mg/l Total Phosphorus and 4 mg/l Total Iron consent. The £60m WINEP upgrade to Knostrop STW was one of YW’s largest investments during AMP7.
Background
An overview of how Yorkshire Water and Stantec UK came to decide on the EBPR and CoMag® systems can be found in a previous article on WaterProjectsOnline: Enhanced Biological Phosphorus Removal Programme (2022). Ward & Burke Construction were named as the primary delivery contractor, with construction starting in April 2022. In 2023, WaterProjectsOnline published a case study which gave a detailed overview of the existing treatment works and how the new assets were to be integrated into the site (see Knostrop STW 2023).
In this year’s article, the Project Delivery Team are pleased to provide an update on the performance of the treatment works following construction completion in October 2024; meeting the 20 December 2024 regulatory date.
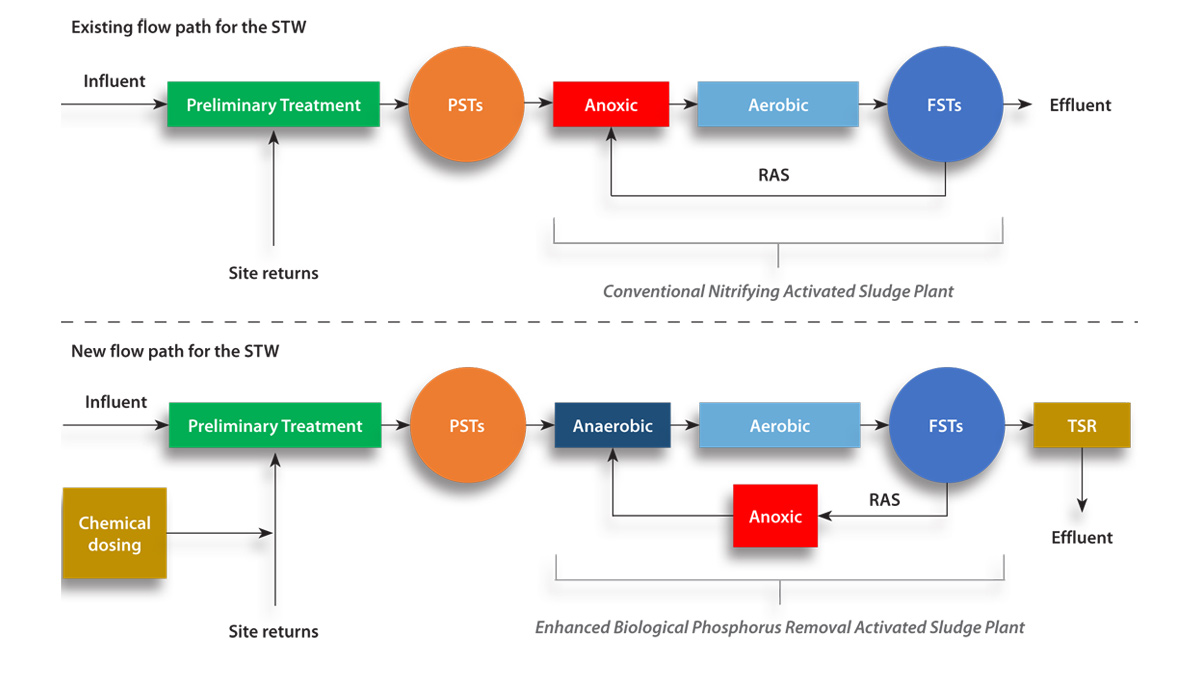
Figure 1: An overview of the changes to the process flow path – Courtesy of Ward & Burke
Project summary
To achieve the new 0.4 mg/l Total Phosphorus consent, chemical treatment of the final effluent was required. However, to reduce the amount of chemicals required to reach this concentration, two EBPR processes (EBPR1 and EBPR2) were created by modifying the two existing activated sludge plants (ASPs).
The chosen EBPR layout is a modified Johannesburg configuration, which requires the recycled activated sludge (RAS) from the final settlement tanks (FSTs) to go through an anoxic tank before being discharged back into the existing nitrifying ASP.
This then combines with the influent wastewater within each of the two existing anaerobic zones before entering the aeration lanes – see Figure 1 (above) for details.
Enhanced Biological Phosphorus Removal
To convert the existing ASP2 to an EBPR configuration, the oldest activated sludge plant (ASP1) was decommissioned and then retrofitted to function as the RAS anoxic tank.
ASP1 was split into four lanes, so conversion involved removing the baffle walls and the surface aerators within the lanes and installing 16 new submersible mixers (four per lane). The effluent from this anoxic tank then flows to a new RAS pumping station, which then pumps back to the existing activated sludge plant (ASP2).
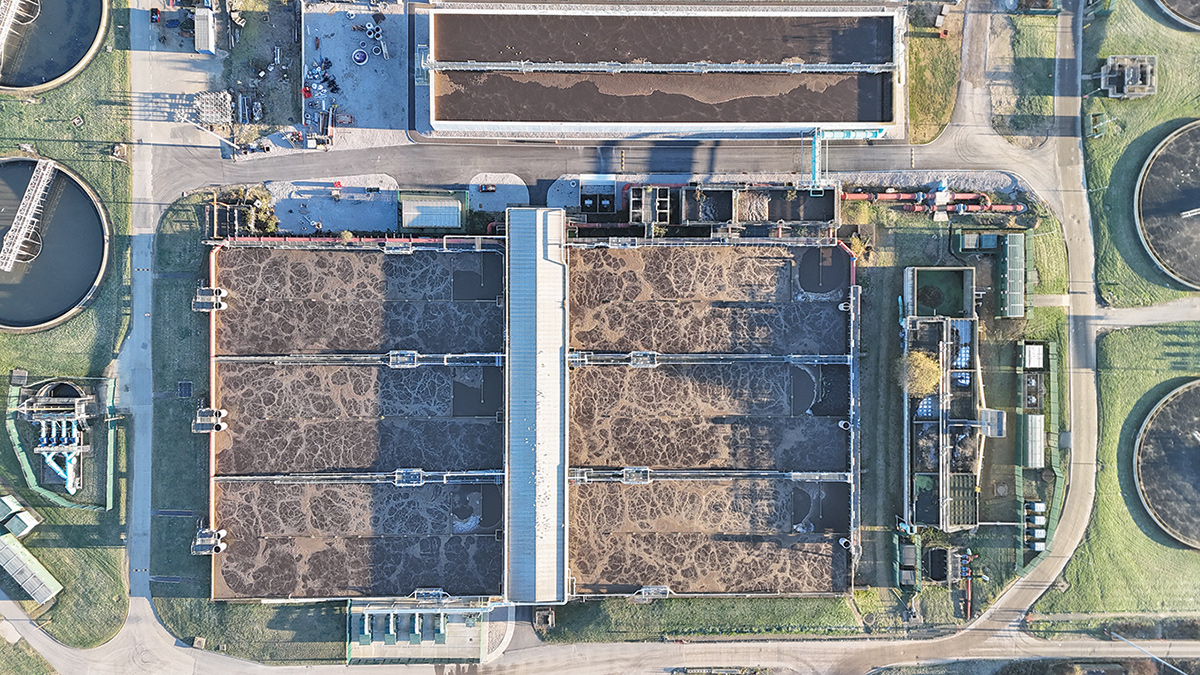
The new RAS anoxic tank (top) and ASP3 (bottom) – Courtesy of Emma Varley
Keeping the process running while diverting the RAS flow was critical to maintain compliance. Under-pressure tappings and commissioning valves were used to facilitate this work, enabling the new 1400mm pipelines to be laid completely offline.
Once everything was dry commissioned, the valves were simply turned to change the RAS flow direction, which has enabled the process conversion from a conventional nitrifying ASP to the new EBPR configuration. This conversion was done in a stepped fashion, first allowing flow into Lanes 1 and 2, and then allowing the RAS flow into the next anoxic lane once the mixed liquor suspended solids (MLSS) in the operating ASP had recovered. This process was done over a 2-week period.
Initially, there was no visible change in the Ortho-Phosphate concentration coming from ASP2 when compared to ASP3 (yet to be converted). As predicted, the MLSS dropped after the first diversion, which increased the air demand for the ASP.
To combat this, the removal of the surplus activated sludge (SAS) was stopped for this period, allowing the MLSS to recover, and more flow was sent to the other ASP. Three weeks after all four lanes were in service within the anoxic tank, a drop in Ortho-Phosphate was seen coming off ASP2 compared to ASP3 – see Figure 2 (below). This increased further in the following 2 weeks.
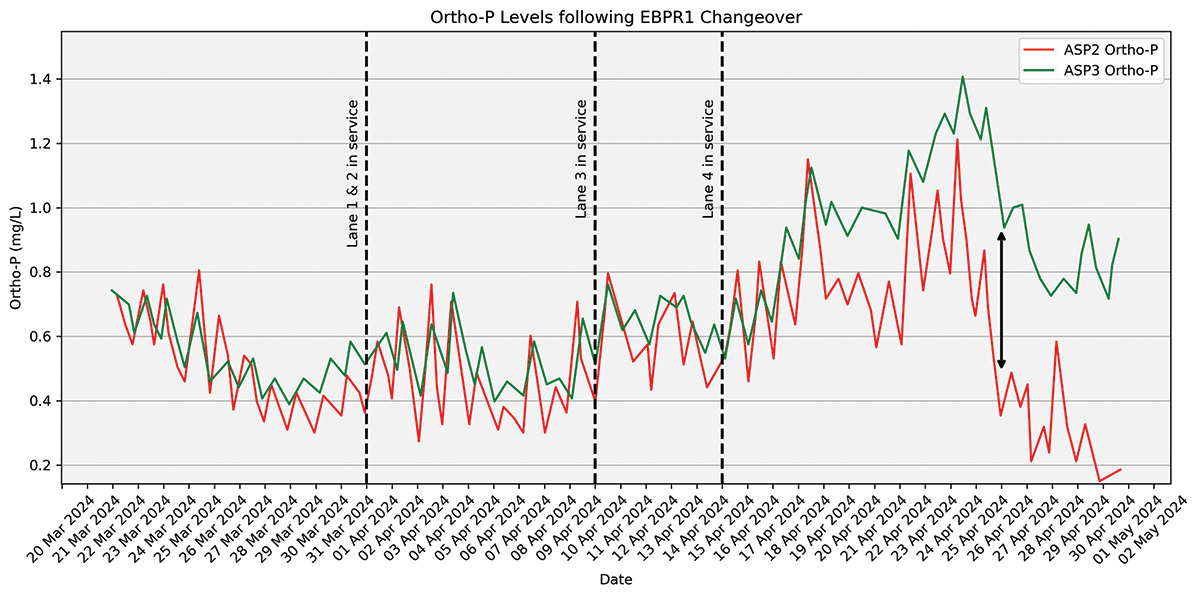
Figure 2: Ortho-Phosphate levels following EBPR1 changeover – Courtesy of Ward & Burke
For EBPR2, a new 14,000m3 RAS anoxic tank was built. The RAS is pumped by the existing RAS pumping station into the new anoxic tank, before gravitating back to the start of ASP3. Again, an under-pressure tapping was used to install the commissioning valves to enable RAS flow diversion, and a limpet dam was used to enable tying back into ASP3. Commissioning EBPR2 and diverting the RAS flow into the new RAS anoxic tank was done in a similar fashion to ASP2, however without the flexibility of multiple lanes to fill in a stepped fashion. To combat this, the MLSS was increased even more prior to changeover. No impact was seen to the ASPs performance and following four weeks, the Ortho-Phosphate was seen to reduce to similar levels as ASP2.
Energy usage
As part of the conversion to EBPR, both ASP2 and ASP3 had a full aeration upgrade. This investment was to reduce the energy consumption that the existing system was having on site, and to try and offset the energy increase that was inevitable due to the TSR chemical treatment required to achieve a 0.4 mg/l TP consent.
A total of 14 aeration lanes were upgraded in a staggered fashion to enable continued treatment of the wastewater. This involved the complete overhaul of diffusers, pipework, instrumentation, valves and blowers.
Figure 3 (below) shows the total power requirements of the existing ASP2 blowers for the 18-months prior to the upgrade (red line), and then the energy consumption of the new blowers following the changeover (blue line). There is a marked drop, with average daily energy consumption dropping from 665 kW to 478 kW, yielding a 28% decrease. Additionally, before the upgrade, ASP2 blowers accounted for between 51% – 72% of total electricity required to run the site. Since the aeration upgrade, blower energy consumption has decreased by approximately 10% – 20%.
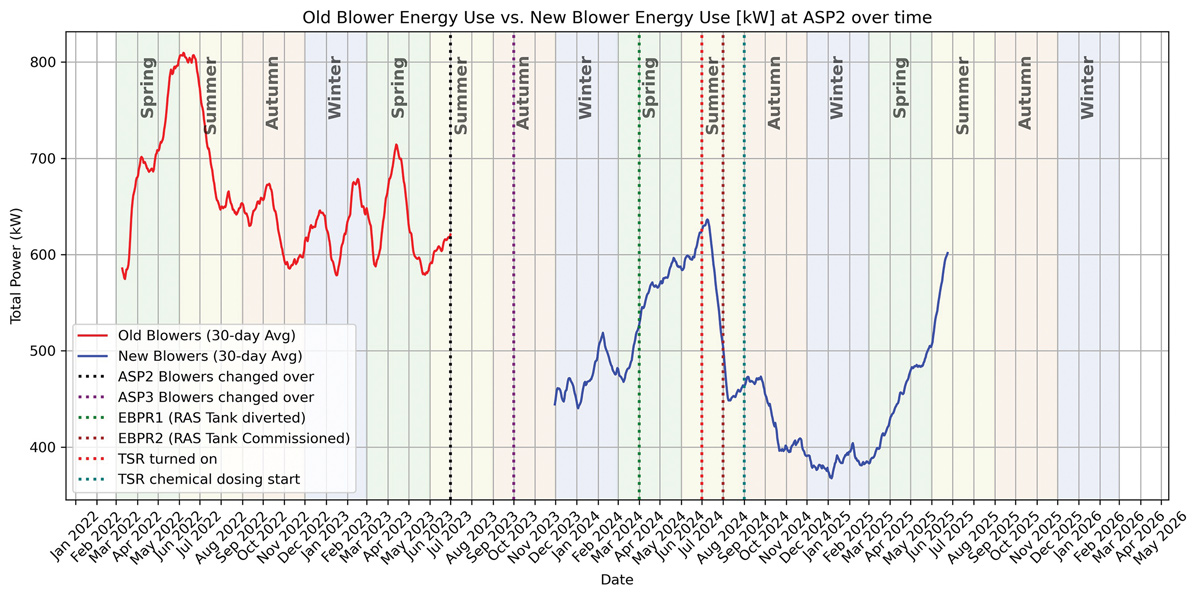
Figure 3: ASP2 blower energy use – old vs new – Courtesy of Ward & Burke
The ASP2 aeration upgrade and blower changeover were finished in July 2023. The work to divert the RAS flow into the new anoxic tank was then completed in April 2024, when ASP2 was switched over to run as EBPR. ASP3 followed a similar pattern, with the aeration upgrade and blower changeover finished in October 2023, and the RAS flow diverted in August 2024 to bring ASP3 online as EBPR2.
Electricity demand for the site experienced a downward trend once the ASP2 and ASP3 upgrades were in place, as seen in Figure 4 (below). This is down to the efficiency of the new blowers, but also the lower air demand often seen in EBPR systems. There is then a rise in electricity requirements following commissioning of the TSR, however the ASP upgrades seem to have offset this additional electricity demand, without a significant increase in overall electricity usage.
Further efficiencies were achieved by implementing Ammonia-based aeration control (ABAC). ABAC optimises the process by aerating only when Ammonia at the back end of the lanes starts to reach a defined value. This reduces energy demand through aligning aeration energy demand with actual loading levels, compared to conventional dissolved oxygen set points. This allows for demand-driven real-time process control, as well as smoother operation of the blowers. The new ASP2 blowers and ABAC have contributed to less electricity demand required to run this process. This is a significant gain as aeration is one of the key energy consumers across almost all WwTWs.
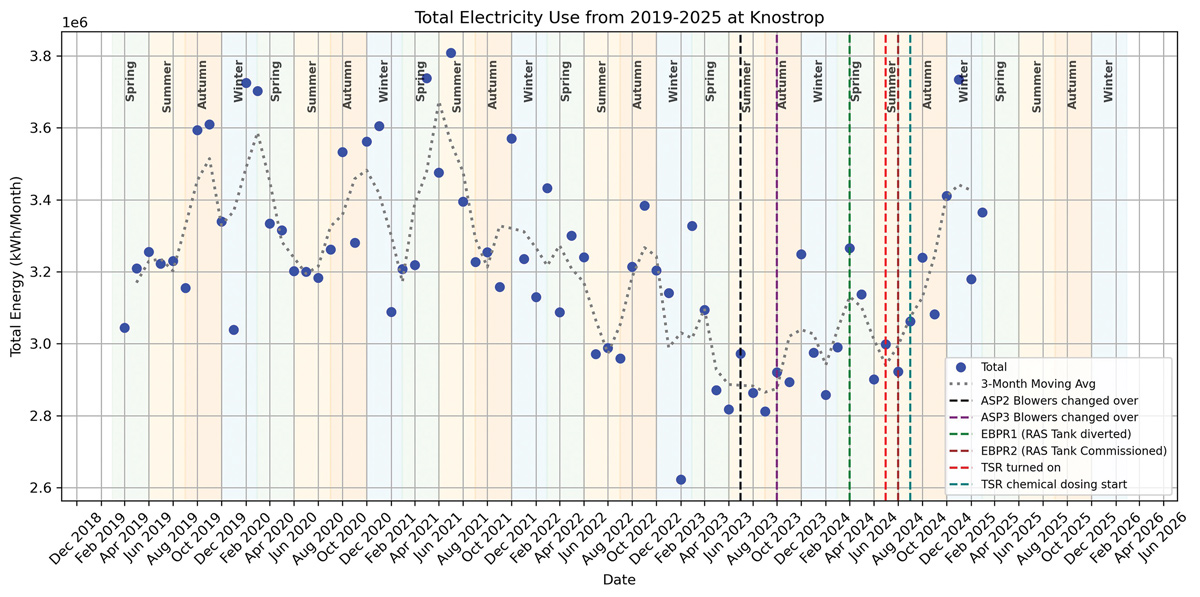
Figure 4: Total energy use from 2019 – 2025 at Knostrop STW – Courtesy of Ward & Burke
Knostrop STW: Supply chain – key participants
- Outline design: Stantec UK
- Detailed design & delivery contractor: Ward & Burke
- Design assurance: Yorkshire Water
- Design assistance & hazard study facilitators: Sweco
- CoMag® technology: Xylem Water Solutions (Evoqua)
- Electrical installation: Circle Control & Design Systems
- Transformers & HV works: Integrated Utility Services
- MCCs & systems integration: Saftronics
- Piling/grouting: Van Elle
- Precast concrete: FLI Precast Solutions
- Access metalwork: GT Fabrications
- Coated steel pipework: Freeflow Pipesystems
- Stainless steel pipework: Franklyn Yates Engineering
- Ductile iron pipework: Saint Gobain PAM UK
- Blowers & mixers: Sulzer Pumps Wastewater Ltd
- Ferric & polymer dosing: NPS Engineering Group
- Flow controls: AFFCO Flow Control (UK) Ltd
- Pumps: Xylem Water Solutions
- Diffusers: SSI Aeration
- Kiosks: Morgan Marine
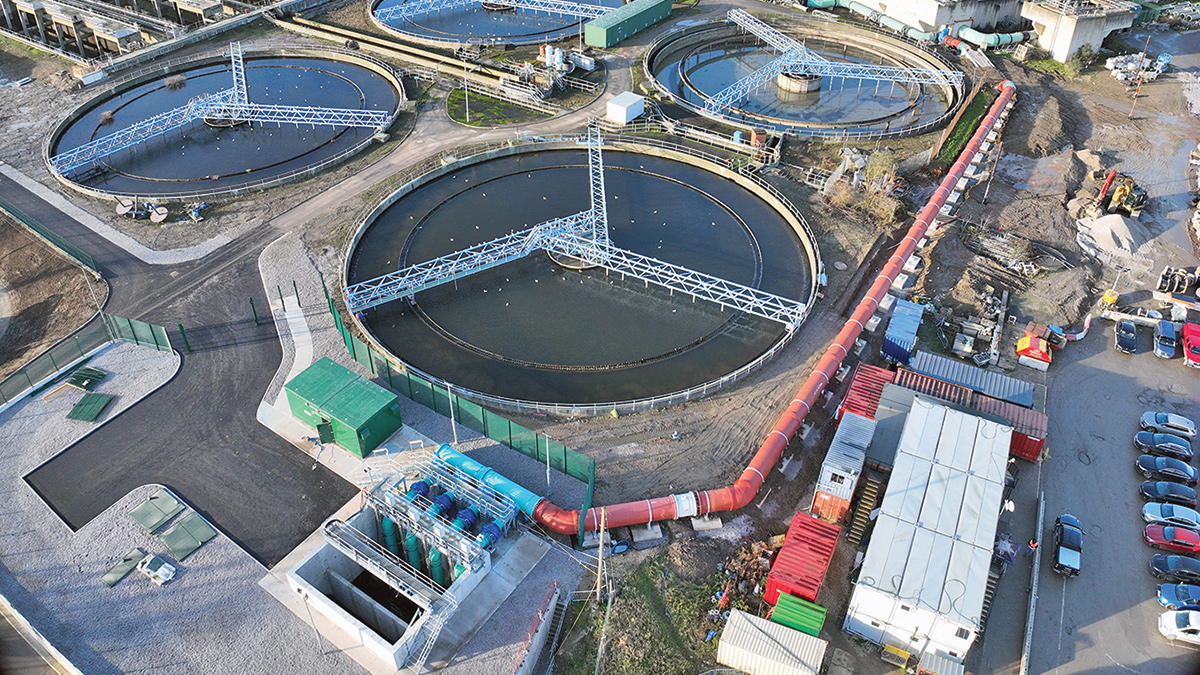
The CoMag® TSR – Courtesy of Emma Varley
CoMag® tertiary solids removal plant (TSR)
At the time of construction, the CoMag® TSR built at Knostrop was the largest to be installed of its kind. This new process required a new feed pumping station, reaction tank and a high-rate clarifier to be able to treat 4,032 l/s, which is 75% of the permitted pass forward flow (PFF) at Knostrop plus the total site returns and backwashes. This technology required a new ferric sulphate, polymer, and magnetite dosing plant, as well as a washwater system and a sludge recycle and return system. A new final effluent sampling kiosk has been installed on the outlet of the TSR, and two live tie-ins were conducted to facilitate the existing flows to be diverted into the new system.
Flows were diverted through the TSR in August 2024 to allow for wet commissioning. Chemical dosing began in September, followed by a period of optimisation to fine-tune the dosing systems ahead of performance testing in December. The system was commissioned on a ferric sulphate flow proportional mode of 8mg/l to meet the consent limit of 0.4 mg/L Total Phosphorus, while keeping Total Iron levels below 4 mg/L.
Additionally, although the polymer type FLOPAM AN 923 showed the best performance during the bench scale jar-tests, FLOPAM 945 was finalised to be the most effective at a concentration of 2 mg/l, which was further reduced during commissioning to 1.25 mg/l.
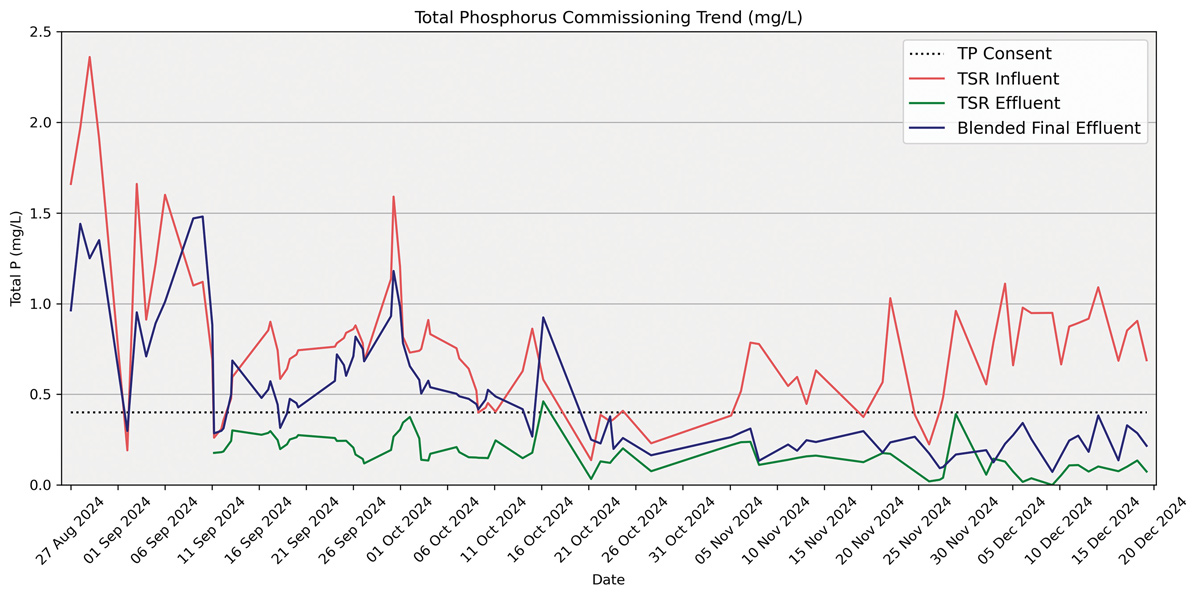
Figure 5: Total phosphorus during process optimisation in the TSR influent, TSR effluent, and blended final effluent – Courtesy of Ward & Burke
The TSR is sized for 75% of the site’s PFF with a portion at higher flows to be bypassed resulting in a blended final effluent. Figure 5 (above) shows that the from the start of chemical dosing in September, the TSR effluent remained below consent for the entire commissioning period, apart from one day on the 16th of October when the site ran out of chemical. During the 14-day performance test for the TSR, the plant maintained a rolling average significantly below 0.4 mg/L TP for both spot and composite sample.
Due to the continued effective treatment of the CoMag® and EBPR system, and to further optimise chemical consumption, the chemical dose rate was then reduced over a period of 6-weeks. Figure 6 (below) shows the reduction of 8.5 mg/l down to 4.8 mg/l.
At a ferric sulphate dose rate of 5 mg/l, Total Phosphorus remained below consent, however, any at 4.8 mg/l, effluent Total Phosphorus started to rise towards consent levels. The site has therefore been left dosing at a rate of 5 mg/l or above to maintain consent levels. EBPR fluctuates seasonally and reduces or increases the Total Phosphorus coming into the TSR. During periods of reduced Total Phosphorus, the site can bypass more of the flow, thus using less chemical and energy to treat the wastewater.
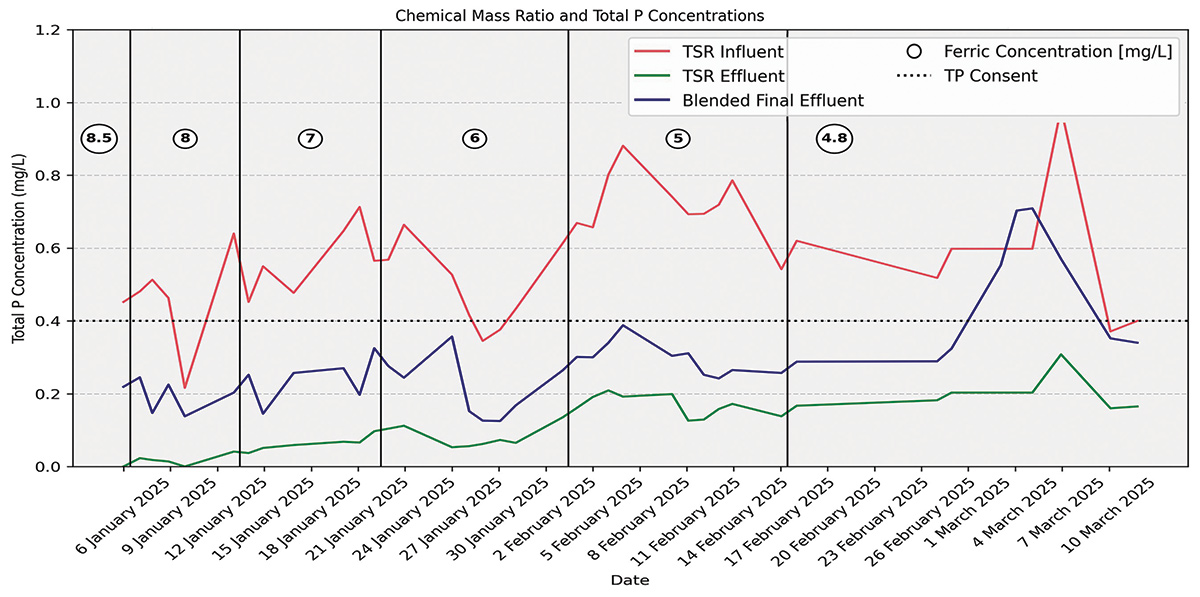
Figure 6: Total phosphorus during the chemical reduction process in the TSR influent, TSR effluent, and blended final effluent – Courtesy of Ward & Burke
Completion
April 2025 marked the completion of the Knostrop EBPR project. With the new EBPR and CoMag® systems, the site has consistently met the new Total Phosphorus and Total Iron consent, with reduced energy consumption and a more reliable and efficient aeration system.
The new RAS anoxic pumping station and 1400mm discharge pipework back to ASP2 - Courtesy of SkyTech Surveys